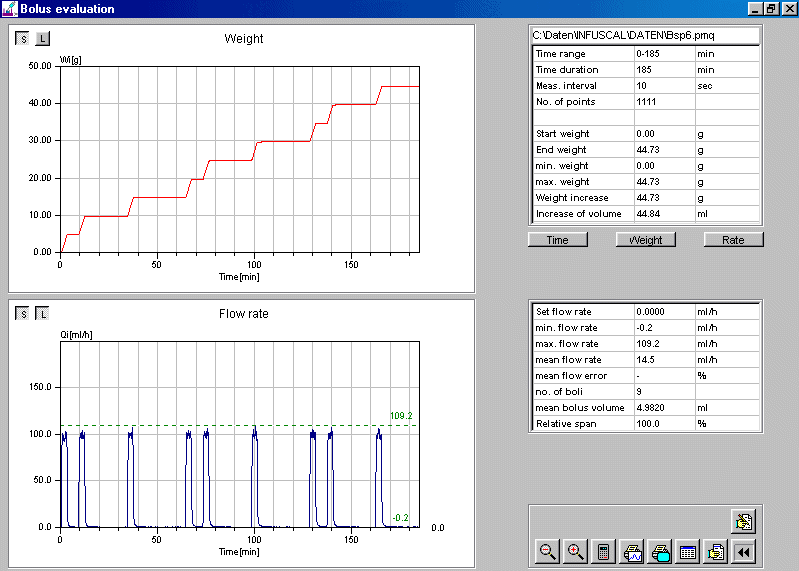
Bolus Curve
In the upper part of the picture below the weight of the delivered liquid is displayed as a function of time. The steps, which represent the delivery of limited liquid volumes (boli) with a high flow rate, can be clearly identified. In this example a total of 9 liquid boli have been delivered. The lower part of the screen shows the flow rate curve. The steep increase of the flow rate during a weight step and its decrease in the time between two boli can be seen very clearly.

[ Back to the top ]
[ Back to the menu level "Bolus evaluation" ]
